
[Python] Data manipulation with pandas(4)
Pandas
- Creating and Visualizing DataFrames
.plot()- kind=”bar”/ “line”/ “scatter”
.hist().legend()
- Missing data
.isna()
- Read & write dataframe
pd.read_csv().to_csv()
# import data
import seaborn as sns
import pandas as pd
import matplotlib.pyplot as plt

iris = sns.load_dataset("iris")
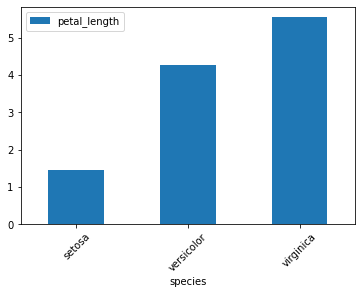
.plot()
- kind=”bar”
petal_len_by_species = iris.groupby("species")[["petal_length"]].mean()
petal_len_by_species.plot(kind="bar")
plt.show()
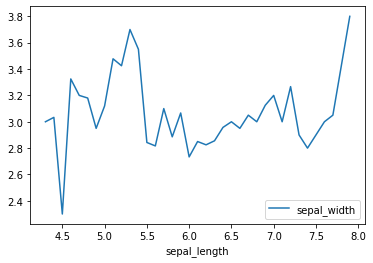
- kind = “line”
sp_wd_by_sp_len = iris.groupby("sepal_length")[["sepal_width"]].mean()
sp_wd_by_sp_len.plot(kind="line")
plt.show()
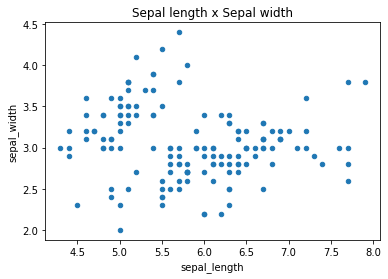
- kind = “scatter”
iris.plot(x="sepal_length",
          y="sepal_width",
          kind="scatter",
          title="Sepal length x Sepal width")

plt.show()
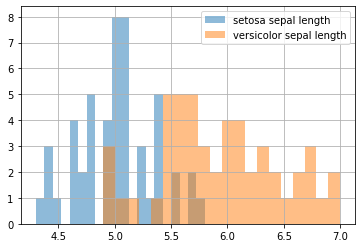
.hist()
- pandas Series로 subsetting 한 경우 <AxesSubplot:>이 되어 2개의 그래프가 하나의 그래프로 표현될 수 있음
iris[iris.species=="setosa"]['sepal_length'].hist(alpha=0.5, bins=20)
iris[iris.species=="versicolor"]['sepal_length'].hist(alpha=0.5, bins=20)
plt.legend(['setosa sepal length','versicolor sepal length'])
plt.show()
.isna()
- .any()
- .sum()
# column별 missing value 존재 유무 확인
iris.isna().any()

# column별 missing value 개수 확인
iris.isna().sum()
sepal_length    0
sepal_width     0
petal_length    0
petal_width     0
species         0
dtype: int64
.dropna()
- 결측값이 존재하는 row 삭제
iris.dropna().head()
| sepal_length | sepal_width | petal_length | petal_width | species | |
|---|---|---|---|---|---|
| 0 | 5.1 | 3.5 | 1.4 | 0.2 | setosa |
| 1 | 4.9 | 3.0 | 1.4 | 0.2 | setosa |
| 2 | 4.7 | 3.2 | 1.3 | 0.2 | setosa |
| 3 | 4.6 | 3.1 | 1.5 | 0.2 | setosa |
| 4 | 5.0 | 3.6 | 1.4 | 0.2 | setosa |
.fillna()
- 결측값 채워넣기
iris.fillna(0).head()
| sepal_length | sepal_width | petal_length | petal_width | species | |
|---|---|---|---|---|---|
| 0 | 5.1 | 3.5 | 1.4 | 0.2 | setosa |
| 1 | 4.9 | 3.0 | 1.4 | 0.2 | setosa |
| 2 | 4.7 | 3.2 | 1.3 | 0.2 | setosa |
| 3 | 4.6 | 3.1 | 1.5 | 0.2 | setosa |
| 4 | 5.0 | 3.6 | 1.4 | 0.2 | setosa |
Creating dataframes
- 1) from a dictionary of lists
- 2) from a list of dictionaries
# Create a dictionary of lists with new data
class_dict = {
  "class": ["A", "B"],
  "number_of_students": [40, 38],
  "Teacher": ["Kwon", "Park"]
}

pd.DataFrame(class_dict)
| class | number_of_students | Teacher | |
|---|---|---|---|
| 0 | A | 40 | Kwon |
| 1 | B | 38 | Park |
class_list = [
    {"class": "A", "number_of_students": 40, "Teacher":"Kwon"},
    {"class": "B", "number_of_students": 38, "Teacher":"Park"},
]

pd.DataFrame(class_list)
| class | number_of_students | Teacher | |
|---|---|---|---|
| 0 | A | 40 | Kwon |
| 1 | B | 38 | Park |
pd.read_csv() & .to_csv()
tp = pd.read_csv("temperatures.csv")
tp.head()
| Unnamed: 0 | date | city | country | avg_temp_c | |
|---|---|---|---|---|---|
| 0 | 0 | 2000-01-01 | Abidjan | Côte D'Ivoire | 27.293 |
| 1 | 1 | 2000-02-01 | Abidjan | Côte D'Ivoire | 27.685 |
| 2 | 2 | 2000-03-01 | Abidjan | Côte D'Ivoire | 29.061 |
| 3 | 3 | 2000-04-01 | Abidjan | Côte D'Ivoire | 28.162 |
| 4 | 4 | 2000-05-01 | Abidjan | Côte D'Ivoire | 27.547 |
tp.to_csv("name_of_file.csv")